Halifax Index 2022
Living
You are viewing the 2022 Halifax Index.
To view the current edition, click here.
STILL THE PLACE TO RAISE A FAMILY
The recently approved People. Planet. Prosperity. Halifax’s Inclusive Economic Strategy 2022-27 adds a new top-level reporting metric focused on well-being as measured through the Partnership’s annual City Matters Survey. Given the new strategy’s enhanced attention to inclusion, the primary focus is on decreasing the share of respondents who give a low score to a question on overall life satisfaction, with a benchmark of 14.4% established in the spring 2022 survey. The goal is for this share to shrink over time.
Halifax Transit saw both ridership and hours of service increase in 2021 after declining the previous year. Total hours of operation reached a record high of 927,223. Halifax also boasts the most affordable transit fares for senior and youth riders along with the lowest cost for monthly passes across benchmark cities.
Among ridings that overlapped Halifax, the voter turnout rate declined for the federal election (-15.5 percentage points ) in 2021. However, in these ridings, turnout increased for the provincial election (+2.4 percentage points).
The share of female (+5.5 percentage points), Black (+3.0 percentage points), and other visible minority (+9.0 percentage points) members among Halifax’s 48 elected representatives increased in 2021.
Access to health care is another important ingredient to living well. From December 2020 to December 2021, an additional 13,927 people were added to the waitlist for a primary care physician in Halifax.1
Halifax has experienced a decline in both the Crime Severity Index (CSI) and the Violent Crime Severity Index (VCSI) over the long term. Another key factor to quality of life in Halifax is the way in which climate change and other environmental issues are addressed. The HalifACT climate action plan has set a goal of net-zero community GHG emissions by 2050. Through 2020, Halifax is not on track to meeting its emission-reduction targets.
Jump to a section
Halifax Index 2022
Quality of Life
While economic growth, income, and employment are important metrics in tracking a city’s success, so too are satisfaction, well-being, and all the things that make life easier and more enjoyable. Halifax’s new economic strategy for 2022-27 has explicitly included well-being as a top-level indicator of success.
As a means of better incorporating the concept of inclusion, the specific well-being measure named as a headline metric in the new economic strategy is the share of survey respondents who report a low score when asked about their satisfaction with life. The benchmark share from the 2022 City Matters Survey carried out by MQO Research is 14.4%, and the goal is to reduce this share every year.
The City Matters Survey also asked respondents to rate their satisfaction with various aspects of living in Halifax. Over three-quarters of respondents said they were satisfied or very satisfied with life here. Halifax as a place for recreation and play, to raise a family, and retire received a satisfaction share over 70%. The share of respondents satisfied with Halifax as a place to work and as a place for young people were between 65% and 70%.
In this year’s Index, there also is a mapping tool allowing users to see a variety of facilities throughout the municipality. These include educational, health care, arts, culture, recreation, and sports infrastructure. Proximity and access to such facilities can be important contributors to quality of life, and this tool makes it easy to visualize the presence or absence of facilities in any given area.
-
Question: “Using a scale of zero to ten, with zero (0) meaning ‘Not at all’ and ten (10) meaning ‘Completely,’ how satisfied are you with life nowadays?”
Source: MQO Research, City Matters Survey (2022)
Perceptions of Well-Being
- Halifax’s new economic strategy for 2022-27 has incorporated a metric for subjective well-being as measured by new questions added to the City Matters Survey.
- When asked to rate life satisfaction on a scale from 0 to 10, 62.1% gave scores above 7.
- As part of an enhanced focus on inclusion, the primary well-being metric is focused on the share that gave a response of 4 or lower - individuals who may not be fully sharing in Halifax’s overall growth and success. The goal of the new strategy is to reduce this share from the initial benchmark of 14.4%.
- The overall mean score for this question was 6.7. For male and female respondents, respectively, the mean scores were 7.0 and 6.4. The mean score for those ages 55+ was 7.2; for those in the 18 - 34 and 35 - 54 age brackets, the means were 6.4 and 6.5, respectively.
DOWNLOAD THE DATA: WELL-BEING.XLSX -
Question: “Please tell us how satisfied you are with the following quality of life aspects of the municipality.”
Source: MQO Research, City Matters Survey (2022)
Aspects of Quality of Life in Halifax
- The 2022 City Matters Survey asked respondents about their general satisfaction with life in Halifax as well as about specific aspects of living here.
- Over three-quarters of respondents reported being satisfied or very satisfied with life in Halifax. The same share was satisfied or very satisfied with Halifax as a place for recreation and play.
- Slightly lower satisfaction shares in the 70% range were reported for Halifax as a place to raise a family, as a place for young people, and as a place to retire.
- The lowest satisfaction share, 65.2%, was reported for Halifax as a place to work.
DOWNLOAD THE DATA: ASPECTS-OF-LIFE.XLSX -
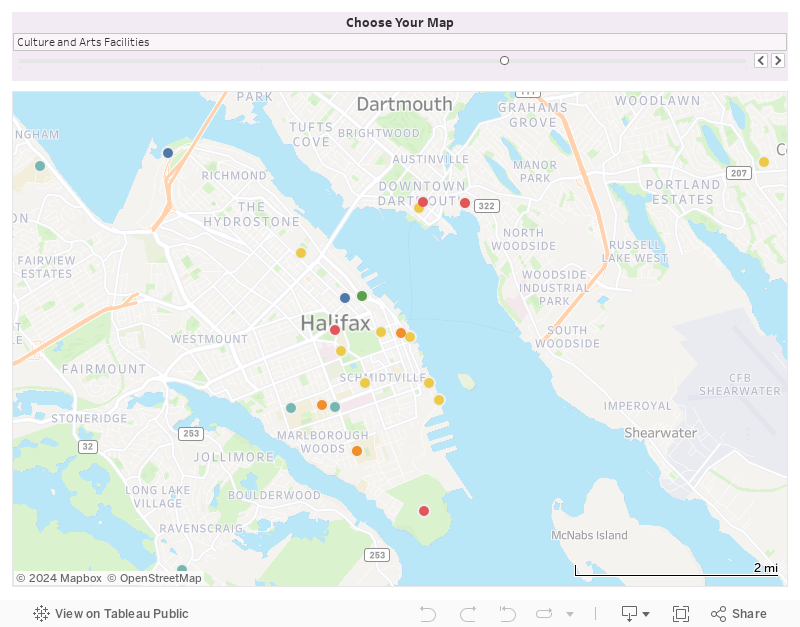
Facilities
- Access to facilities and services is an important component of residents’ quality of life.
- This map illustrates how many educational, health care, arts, culture, recreation, and sports facilities are located throughout Halifax Regional Municipality.
- Hovering over the dots brings up the name, type, and address of the facility.
- With a quick glance, the map demonstrates the presence – or the absence – of various types of facilities in any given area.
Halifax Index 2022
Transportation
Transit usage cratered in 2020-21 as COVID-19 kept people in their homes, but there was a rebound in 2021-22. Halifax Transit increased its hours of operation in 2021-22 by 13.7%, which represents 111,597 hours more than the 2020-21 total. The total of 927,223 hours of operation is the most recorded in Halifax Transit’s history. This increase was driven by new bus routes added to increase community connectedness. Ridership also saw a big jump from the slump of 2020-21, growing by 60.5% or 5.1 million rides. Although this was the largest annual growth ever seen, the total ridership of 13.4 million remains well below the high of 20.6 million rides set in 2019-20.
Halifax has the lowest fares for senior and youth riders across benchmark cities, along with the lowest average monthly fare. Halifax’s single fare is the third lowest across benchmark cities, $0.25 above St. John’s and Victoria.
High ridership does not always correlate with improved satisfaction. However, residents’ satisfaction with the public transit system (conventional bus and ferry) has improved substantially since 2019. The share of riders who were very satisfied increased by 4.2 percentage points and those who were satisfied increased by 15.8 percentage points between 2019 and 2021. The increase in satisfaction was mirrored by a decrease in the share of those dissatisfied or very dissatisfied (-20 percentage points) over the same period.
-
Source: Halifax Regional Municipality, Halifax Transit
Transit Passenger Volume and Hours of Service
- After a decline of 12.2 million rides (-59.4%) from 2019-20 to 2020-21, Halifax Transit’s total ridership bounced back by 5.1 million rides in 2021-22. However, the 2021-22 figure represents only 65.2% of the 2019-20 pre-pandemic ridership level.
- Total hours of service, which had also declined in 2020-21 by 11.3%, increased 13.7% (+111,597 hours) in 2021-22 and reached an all-time high.
DOWNLOAD THE DATA: TRANSIT.XLSX -
TRANSIT FARES BY TYPE OF FARE
Dollars per Fare, Benchmark Cities, 2022
Type of Fare
St. John's
Halifax
Quebec City
KCW
Regina
Victoria
Single Fare
$2.50
$2.75
$3.20
$3.25
$3.25
$2.50
Monthly Pass
$83.00
$82.50
$89.75
$90.00
$88.00
$85.00
Senior Fare
$2.50
$2.00
$2.60*
$2.49**
$3.25
$2.50
Youth Fare
$2.00
$2.00
$2.60*
$2.49**
$2.75
$2.50
*Discount only available using tickets and/or “stored value payments.”
Source: Various Municipal Sources
Fare Costs
- There were many adjustments to transit fares across Canada in 2021 to promote the recovery of public transit use. Halifax’s transit fares remain among the most affordable across benchmark cities.
- Although St. John’s and Victoria, at $2.50, have a lower single fare than Halifax, Halifax’s monthly fare ($2.75), senior fare ($2.00), and youth fare ($2.00) are lower than in every benchmark city.
-
Question: “Please tell us how satisfied you are with the following service provided by the municipality: Public Transit – conventional bus and ferry.”
Source: Halifax Regional Municipality, Halifax Citizens’ Survey (Various)
Citizens' Ratings of Public Transit
- Halifax residents’ rating of public transit has seen considerable improvement over the past few years.
- The share of riders dissatisfied or very dissatisfied with transit service has declined 20 percentage points since 2019 while the share satisfied or very satisfied with service has correspondingly increased 20 percentage points.
DOWNLOAD THE DATA: RATINGS-OF-TRANSIT.XLSX
Halifax Index 2022
Community
Trust in others and in institutions, participation in democracy, and inclusive representation are all indicators of civic health.
The 2022 City Matters Survey asked questions about levels of trust among Halifax residents. When asked if most people in the community could be trusted, 59% of respondents replied positively. Males (69%) reported a much higher feeling of trust than did females (50%). Additionally, as has been the case since 2018, older and rural respondents were more likely to state that they trust others in the community.
Election turnout varies from federal (higher turnout) to provincial (medium) to municipal (lower) elections, and Halifax has experienced reasonably consistent turnout rates over the last decade.
Federal elections held in 2021 had a decreased voter turnout rate of 62.5% (-15.5 percentage points from the previous federal election). However, the 2021 provincial turnout rate, at 55.7%, was 2.4 percentage points higher than in 2017.
Halifax elects 48 representatives2across all three levels of government and currently, 42% (20) of the representatives elected are female, an increase of 5 percentage points from last year. Male representatives make up 58% of the representatives. The share of Black representatives and representatives of other visible minority status are 10% and 13%, respectively. There are no Indigenous representatives.
-
RESIDENTS’ FEELINGS OF TRUST
Share of Responses, Halifax, 2022
Response
Overall
Gender
Age
Area
Male
Female
18 - 34
35 - 54
55+
Urban
Rural
Yes
59%
69%
50%
53%
51%
75%
58%
63%
No
29%
29%
26%
34%
33%
18%
28%
25%
Don’t know
13%
9%
17%
19%
14%
7%
14%
12%
Prefer not to say
1%
1%
1%
0%
1%
2%
1%
1%
Survey Question: “Do believe that most people can be trusted?”
Source: MQO Research, City Matters Survey (2022)
Feelings of Trust
- The 2022 City Matters Survey found that 59% of respondents believed that most people in their community could be trusted; 29% and 10% of respondents stated most people could not be trusted or that they didn’t know, respectively.
- More males (69%) than females (50%) felt most people could be trusted, and older respondents were more likely to be trusting of their community than younger respondents.
- Halifax’s rural residents (63%) were more trusting of the community than urban residents (58%).
-
Survey Question: “Do believe that most people can be trusted?”
Source: Source: MQO Research, City Matters Survey (Various)
Feelings of Trust Over Time
- Since 2018 when the City Matters Survey first gathered data on trust, 2020 saw the largest number of respondents (67%) who felt most people in the community could be trusted. After a 9 percentage-point drop in that share between 2020 and 2021, an increase of 1- percentage point occurred in 2022 bringing the share of people who trust most people to 59%.
- On the other hand, the share responding that most people cannot be trusted declined 9 percentage points between 2018 and 2020.
DOWNLOAD THE DATA: TRUST-OVER-TIME.XLSX -
*Methods for enumerating eligible voters vary slightly between jurisdictions.
Source: Various including Elections Canada, Elections Nova Scotia, and Halifax Regional Municipality
Voter Turnout By Election
- The 2021 provincial election saw an increase in the voter turnout rate of 2.4 percentage points over the 2017 election. However, the turnout rate for the federal election decreased by 15.5 percentage points from 2019.
- For all elections except the federal, the most recent election saw higher voter turnout than the prior election.
DOWNLOAD THE DATA: VOTER-TURNOUT.XLSX -
Source: Various including 2016 Census Canada, Halifax Regional Municipality, House of Commons Canada, and the Nova Scotia Legislature
Elected Officials' Representativeness
- Comparing against numbers from the 2016 Census, the share of male elected representatives is 10 percentage points greater than the male share of the general population while the share of female elected representatives is 10 percentage points lower than the female share of the population.
- The share of Black (10%) and other visible minority (13%) representatives has increased by 3 and 9 percentage points, respectively, since 2021. The share of representatives who are not a visible minority (77%) decreased 10 percentage points over the same period. There are no elected Indigenous representatives.
DOWNLOAD THE DATA: REPRESENTATIVENESS
Halifax Index 2022
Health
Health care in Halifax (and indeed throughout Nova Scotia)3has had to adapt in the face of a global pandemic, including new variants of COVID-19 and significantly higher case counts than the province experienced in 2020. The share of people in Halifax over the age of 65 continues to rise, albeit more slowly than before. These factors have put a strain on the health care system, leading to longer waitlists and issues of access to primary care physicians. The province still struggles to achieve comparable health outcomes to other provinces though Nova Scotians are more likely to participate in activities that have positive health outcomes such as COVID-19 vaccination, influenza vaccination, and physical activity.
Nova Scotia was among the quickest provinces to get vaccinated against COVID-19. As of January 1, 2022 over 81% of Nova Scotia’s adults had been fully vaccinated,4with 88% of Nova Scotians receiving at least one dose of a vaccine. Looking at the country as a whole, 77% of adults were fully vaccinated by the start of 2022, with 83% receiving at least one dose.
Nova Scotia’s high vaccination rates also extend to immunization against influenza. More Nova Scotians got their flu immunization in 2020 than any other province, with 56.5% getting a vaccination, up from 49.4% in the year prior. This rate is well above the Canadian average of 39.0%.
The most frequent way Nova Scotians interact with the health care system is through their primary care physician or other regular health care provider. The share of Nova Scotians who had access to a regular health care provider increased to 87.8% in 2020, up from 85.6% in 2019. This coincides with the decreasing waitlist sizes reported in last year’s Index.
However, in 2021, the size of waitlists increased both in Halifax1and across the province. Between December 2020 and December 2021, an additional 12,688 people in Halifax were added to the waitlist. This increased the share of the city’s population5on the waitlist from 2.1% to 5.2%.
To improve access, the Province is innovating its approaches to health care. Just over 19,000 Nova Scotians (or 22% of the province’s total waitlist) have registered with the VirtualCareNS Program – a virtual primary care clinic that provides care to those waiting for a primary care physician.
In 2020, Nova Scotians reported much higher rates of chronic health conditions, well above other provinces and the Canadian average. In terms of arthritis, diabetes, asthma, COPD,6high blood pressure, and mood disorders, Nova Scotians report at a higher rate than Canadians as a whole. This is most noticeable in terms of arthritis, where 26.2% of Nova Scotians experience the condition compared to 19.1% of Canadians. Mood disorders are another category where a much larger share of Nova Scotians (16.2%) report conditions compared to other Canadians (9.0%).
Compared to other provinces containing benchmark cities, Nova Scotia has the highest rates for asthma (12.1%), COPD (7.6%), and mood disorders (16.2%). While Newfoundland and Labrador has the highest rates for most of the other chronic health conditions in the Canadian Community Health Survey (CCHS), Nova Scotia is the second highest in its rates of arthritis (26.2%), diabetes (9.7%), and high blood pressure (20.7%). All of these figures are higher than their respective national averages.
In 2020, Nova Scotians were in the middle of the pack in terms of their perceptions of their health, mental health, and overall life satisfaction. The CCHS asks Canadians to rate their own health and reports the share who respond with “very good” or “excellent.” Among the six provinces with a benchmark city, Nova Scotia was fourth in terms of physical health (61.7%), third in terms of mental health (66.5%), and last in terms of life satisfaction (91.7%).
-
*The criteria for being considered fully vaccinated, according to the Public Health Agency of Canada, vary depending on which vaccine was received and may differ in Quebec. These measures do not account for booster doses. For more details see: https://health-infobase.canada.ca/covid-19/vaccination-coverage/technical-notes.html#a5
Source: https://health-infobase.canada.ca/covid-19/vaccination-coverage/
Vaccination Rate by Province
- The Atlantic provinces lead the way in terms of the share receiving vaccination against COVID-19. Nova Scotia has the second-highest vaccination rate among provinces, with 88.0% receiving one or more doses, and the third-highest rate among those who are considered fully vaccinated (81.1%).
- Newfoundland and Labrador has the highest share of any province both in terms of the share with one or more vaccine doses (93.4%) and the share who are considered fully vaccinated (86.0%).
DOWNLOAD THE DATA: VACCINATION-RATE.XLSX -
Source: Statistics Canada, Canadian Community Health Survey, Table 13-10-0096-01
Access to a Regular Health Care Provider
- The share of Nova Scotians with access to a regular health care provider recovered in 2020, rising from 85.6% in 2019 to 87.8% in 2020. However, it is still below its 2015 level of 88.7%. This share is above the national average of 85.8%.
- While Quebec has the lowest share of adults with access to a regular health care provider (80.6% in 2020), it is almost the most improved since 2015.
DOWNLOAD THE DATA: ACCESS-TO-HEALTH-CARE.XLSX -
Waitlist Length for Primary Care Provider
- Despite progress in early 2020, the share of the population on a waitlist climbed considerably in 2021. Between December 2020 and December 2021, an additional 30,353 Nova Scotians were added to the waitlist increasing the share from 5.6% of the population to 8.9% of the population.
- Between December 2020 and December 2021 the VirtualCareNS Program registered 19,000 Nova Scotians (22% of the waitlist) for virtual primary care.
- All regions within Halifax have seen larger waitlists, with increases in both the absolute number of Nova Scotians waiting for a primary care physician and the share of the region’s population.
- The waitlist for Halifax increased by roughly 12,700 people, going from 2.1% of the population in December 2020 to 5.2% of the population in December 2021.
- Waitlists in Dartmouth-Southeastern and Eastern Shore-Musquodoboit were the lowest in proportional terms, at 4.4% and 4.6% of the population, respectively.
- Waitlists in Halifax and its regions are, on average, lower in 2021 than they were in 2018. However, the waitlist for the entire province has grown over this same time.
DOWNLOAD THE DATA: WAITLISTS.XLSX -
ACTIVITIES AND CONDITIONS IMPACTING HEALTH
Share of Adults Ages 12 and Older, Provinces Containing Benchmark Cities, 2020
Indicators
NS
NL
QC
ON
SK
BC
Current smoker, daily or occasional
13.2%
19.0%
15.2%
11.6%
16.0%
10.1%
Heavy Drinking
18.6%
21.0%
17.5%
15.0%
18.5%
17.1%
Influenza immunization in the past 12 months
56.5%
50.0%
23.9%
42.4%
48.8%
42.1%
Arthritis*
26.2%
27.7%
19.3%
18.5%
17.6%
18.1%
Diabetes
9.7%
11.4%
7.0%
7.4%
6.9%
5.4%
Asthma
12.1%
9.1%
8.7%
8.5%
7.4%
9.0%
Chronic obstructive pulmonary disease (COPD)** 7.6% 5.5% 4.2% 3.8% 4.6% 3.0% High blood pressure 20.7% 23.9% 16.5% 16.9% 20.6% 15.2% Mood disorder 16.2% 10.4% 6.0% 9.4% 11.2% 9.4% *Among respondents ages 15 and older.
**Among respondents ages 35 and older.Source: Statistics Canada, Canadian Community Health Survey, Table 13-10-0096-01
Health Conditions
- Nova Scotians were as likely to report smoking as the Canadian average but more likely to report heavy drinking. Among all provinces in Canada, only Newfoundland and Labrador reported higher rates of heavy drinking.
- Nova Scotians were much more likely to report being vaccinated for influenza; during 2020, 56.5% reported an influenza vaccination in the past 12 months. This is up from 49.4% in 2019 and well above the 2020 Canadian average of 39.0%.
-
SELF-REPORTED PERCEPTIONS OF HEALTH STATUS
Share of Adults Ages 12 and Older, Provinces Containing Benchmark Cities, 2020
Indicators
NS
NL
QC
ON
SK
BC
Perceived health, very good or excellent
61.7%
63.6%
64.8%
62.4%
60.4%
60.1%
Perceived mental health, very good or excellent
66.5%
69.1%
71.0%
63.4%
60.9%
60.9%
Life satisfaction, satisfied or very satisfied
91.7%
94.4%
94.9%
92.8%
95.1%
92.5%
Perceived life stress, most days quite a bit or extremely stressful
18.9%
13.0%
21.8%
20.0%
15.5%
21.3%
Source: Statistics Canada, Canadian Community Health Survey, Table 13-10-0096-01
Health Perceptions
- Nova Scotians reported having very good or excellent health at roughly the same rate (61.7%) as the national average (62.5%). This same finding holds for mental health, with Nova Scotians and Canadians reporting at 66.5% and 65.0%, respectively.
- Those from Quebec were most likely to report very good or excellent physical health (64.8%) and mental health (71.0%). However, those from Saskatchewan were most likely to report they were satisfied or very satisfied with their life in general.
- Nova Scotians were less likely to report feeling high levels of life stress, 18.9% as compared to 20.4% nationally. Those in Newfoundland and Labrador were least likely to report high levels of stress (13.0%).
Halifax Index 2022
Crime
Halifax continues to see a downward trend in crime and compares well to benchmark cities in terms of the Crime Severity Index (CSI)7and the Violent Crime Severity Index (VCSI).8The CSI and VCSI are published by Statistics Canada and measure the incidence and severity of crimes across Canadian cities.
The most recent CSI statistics (2020) show that Halifax has a score of 61.9, up from 60.9 in 2019. Except for 2019, this is the lowest CSI value the city has seen since recordkeeping began in 1998. This represents a drop of 35.9 points since 2010, the largest decline across benchmark cities over that period.
The VCSI score for Halifax in 2020 was 83.8, down 0.3 points from 2019. The decline since 2010 was 23.0 points, the second largest across benchmark cities. The 2020 score was the third lowest ever recorded, behind the 2016 (82.0) and 2014 (75.1) values.
-
Source: Statistics Canada, Uniform Crime Reporting Survey, Table: 35-10-0026-01
Crime Severity Index and Annual Change
- Halifax’s CSI score increased 1.0 points in 2020. However, at 61.9, the city had the second-lowest CSI score across benchmark cities, as in 2019.
- Quebec City had the lowest CSI value at 42.1, and Regina had the highest at 104.8.
DOWNLOAD THE DATA: CRIME-INDEX.XLSX -
Source: Statistics Canada, Uniform Crime Reporting Survey, Table: 35-10-0026-01
Violent Crime Severity Index and Annual Change
- Halifax’s VCSI dropped 0.3 points in 2020 to 83.8. Halifax had the third highest VCSI figure across benchmark cities.
- The largest VSCI decrease occurred in Regina (-7.4) while the largest increase was seen in Victoria (+9.5).
DOWNLOAD THE DATA: VIOLENT-CRIME.XLSX -
Source: Statistics Canada, Uniform Crime Reporting Survey, Table: 35-10-0026-01
Crime and Violent Crime Severity
- Halifax has been experiencing general long-term declines in both the CSI and the VCSI.
- The Halifax CSI fell 35.9 points from 2010, reaching a 2020 value of 61.9. This is the second-lowest figure the city has ever seen, behind only the 2019 value of 60.9. The highest CSI value in Halifax was 134.8 in 2004.
- Halifax’s VCSI in 2020 was 83.8, the lowest it has been since 2017. Between 2010 and 2020, the VCSI dropped by 23.0 points. Halifax’s highest VCSI value was 154.6 in 2006.
DOWNLOAD THE DATA: CRIME-OVER-TIME.XLSX
Halifax Index 2022
Environment
The environment and climate change are top-of-mind issues in Halifax.
HalifACT, the municipality's comprehensive climate action plan, boasts ambitious goals: reducing community greenhouse gas (GHG) emissions by 75% between 2016 and 2030 and a net-zero goal by 2050. The largest source of GHG emissions in Halifax is the residential sector (1.44 MtCO2e in 2020) followed by institutional/commercial emitters (1.07 MtCO2e).
Halifax’s waste-diversion rate saw a slight decline in 2021, falling to 58% (-2 percentage points). At the same time, the waste disposal rate per capita increased by 6 kg to reach 370 kg per capita. Halifax has goals of 100% waste diversion by 2050 and a waste-disposal rate of 300 kg per capita by 2030.
Nova Scotia’s renewable energy supply has tripled over the last decade, with the 29% share in 2021 holding steady from 2020. In 2021, 47% of the province’s energy still came from coal while 16% came from natural gas and oil. The remaining 8% was imported.
-
RESIDENTIAL WASTE-DIVERSION RATE
Share of Solid Waste, Halifax, 2014 to 2021
Waste Diversion
Year
Diversion Rate
2014-15
61%
2015-16
59%
2016-17
60%
2017-18
60%
2018-19
59%
2019-20
60%
2020-21 58% Source: Halifax Regional Municipality, Transportation and Public Works
Waste Diversion
- The residential waste diversion rate in Halifax fell 2 percentage points to 58% in 2021. This is the lowest since 2015.
- Halifax has a residential waste diversion target rate of 100% by 2050.
- The municipal waste disposal rate was 370 kg per capita in 2021, up 6 kg since 2020. The target is to reach 300 kg per capita by 2030.
-
Source: Nova Scotia Power, Renewable Energy Regulations
Renewable Energy Supply and Requirements
- Nova Scotia maintained its renewable energy supply share at 29% in 2021. Although lower than the original requirement of 40%, this exceeds the adjusted target of 25%.
- 47% of the province’s energy was sourced from coal in 2021, with 16% from natural oil and gas, and 8% from imports.
- Nova Scotia Power is forecasting a 60% renewable energy share by the end of 2022 and 80% by 2030.
DOWNLOAD THE DATA: RENEWABLE-ENERGY.XLSX -
Source: Halifax Regional Municipality, Environment and Climate Change
Greenhouse Gas Emissions and Targets
- With HalifACT, Halifax’s comprehensive climate action plan, the city has made a commitment to reduce emissions and help communities adapt to a changing climate.
- The passing of HalifACT established a municipal operations target of net-zero emissions by 2030, a community-wide target of a 75% emission reduction from 2016 to 2030, and net-zero emissions for the overall community by 2050.
- Between 2016 and 2020, community GHG emissions fell 23.6% (-1.3 million tonnes of CO2 equivalents). To reach the 2030 goal of 1.4 MtCO2e in emissions, an annual average decline of 10.4% will be required between 2021 and 2030.
DOWNLOAD THE DATA: EMISSIONS-TARGETS.XLSX -
Source: Halifax Regional Municipality, Environment and Climate Change
Greenhouse Gas Emissions by Sector
- The largest source of GHG emissions is the residential sector, which emitted 1.44 MtCO2e in 2020, a decline of 16.7% since 2016.
- Institutional/commercial emissions had the second largest share with 1.07 MtCO2e (a 30.1% decline since 2016).
- Emissions from industrial, transportation, and waste operations declined 37.5%, 12.4%, and 7.7%, respectively.
DOWNLOAD THE DATA: EMISSIONS-BY-SECTOR.XLSX