Halifax Index 2021
Living
You are viewing the 2021 Halifax Index.
To view the current edition, click here.
STILL THE PLACE TO RAISE A FAMILY
Halifax continues to be a great place to live and work according to several quality of life measures including public transit, sense of community, and environmental sustainability.
Ratings regarding the convenience, frequency, and scheduling of public transit have improved. The rating for transit affordability dipped slightly although transit fares in Halifax remain among the cheapest across benchmark cities.
One of the largest impacts of the pandemic was on mental health. In Halifax, 21% of City Matters Survey respondents cited difficulties with mental health issues due to COVID-19.
While fewer Nova Scotians have access to a primary care provider, there has also been a significant decrease in the size of waitlists for primary care physicians. The number of people on waitlists in the Central Region (which includes Halifax) has fallen from 6.2% of the population in 2018 to 1.5% in 2020.
Halifax has not been immune to the effects of climate change with an increasing frequency of hot years being recorded in the last 3 decades. With 29% of its energy supply coming from renewable sources in 2020, the province continues to work towards its goal of 40% by 2022. Turning to waste management, the waste diversion rate has increased, and Halifax posted the second-highest composting rate across benchmark cities.
COVID-19 Recovery
Several resident-rated, quality of life indicators declined last year, but this should not come as a great surprise after enduring a pandemic and a related recession. In fact, a number of measures reported this year are second only to the year before. Halifax was able to weather the pandemic relatively well and has good reason to have high expectations for continued positive growth in quality of life measures going forward.
Jump to a section
Halifax Index 2021
Quality of Life
Our annual City Matters Survey, conducted by MQO Research, asked 500 residents to rate Halifax on several indicators on a scale from 1 (very poor) to 10 (excellent).
Perhaps unsurprisingly, mean scores for all indicators of quality of life decreased from 2020 to 2021. The largest drop was in housing affordability, which fell by 0.9 points. This decrease, however, was not an anomaly as this indicator has fallen 1.5 points since 2017. Mean scores for overall quality of life, indoor recreational facilities, and ease of getting around each dropped by 0.2 points. Halifax has always been considered a good place to raise a family, and even though this indicator fell in 2021 to 7.7, it still remains higher than 2019 ratings.
The share of residents who felt “very” or “mostly” safe in the city fell by 10 percentage points from 2020 to 2021 but remains high at 80%. More rural residents (85%) felt safe in their neighbourhood compared to urban residents (80%).
Statistics Canada data show that 87% of Halifax households were satisfied with the quality of their neighbourhood, and 81% were satisfied with the quality of their dwellings.
According to the 2016 census, Halifax had the lowest population density of all benchmark cities. With a larger land area and a sizeable widespread rural community, the average commuting time was longer and the overall share of population living close to transit stops was lower than other benchmark cities. However, the most recent update to the Integrated Mobility Program (IMP)1implementation reported that 90% of Halifax residents in the Urban Transit Service Boundary live within 500 metres of a bus stop.
-
CITY MATTERS SURVEY RESULTS
Mean Scores (1 to 10), Halifax, 2017 to 2021
2017 Mean Score
2018 Mean Score
2019 Mean Score
2020 Mean Score
2021 Mean Score
Status 2020 vs 2021
Overall quality of life
7.2
7.1
7.4
7.7
7.5
Worsening
Housing affordability
5.7
5.5
5.5
5.1
4.2
Worsening
Arts and cultural events
6.8
7.0
6.9
7.4
6.9
Worsening
Good place to raise a family
7.8
7.4
7.6
8.1
7.7
Worsening
Outdoor recreational facilities
6.8
6.9
6.9
7.5
7.2
Worsening
Indoor recreational facilities
6.8
6.8
6.9
7.4
7.2
Worsening
City is easy to get around
5.6
6.0
5.6
6.4
6.2
Worsening
% who feel very or mostly safe
80%
80%
87%
90%
80%
Worsening
Source: MQO Research, City Matters Survey (2021)
City Matters
- All indicators worsened in 2021 from the previous year, perhaps an unsurprising development given the past year was spent living through a pandemic and a related recession.
- Housing affordability set a record low with the mean score dropping almost an entire point. This score has seen a steady downward trend since 2017, and 43% of respondents this year cited it as the most important issue facing the city, 29 percentage points ahead of taxes in second place.
- Compared to 2019 pre-pandemic ratings, 5 indicators improved. The largest increase was in transportation, how easy the city is to get around.
- The rating for perceived safety, which is measured as a percentage share rather than on a 10-point scale, fell 10 percentage points from 2020 to 2021.
-
Source: Statistics Canada, Canadian Housing Survey, Table 46-10-0024-01
Satisfaction With Dwelling and Neighbourhood
- The share of Halifax households satisfied with their dwelling and neighbourhood in 2018 was high at 81% and 87%, respectively.
- The percentage of households “dissatisfied” and “very dissatisfied” with their dwelling and neighbourhood totaled 6% and 4%, respectively.
-
PROXIMITY TO PUBLIC TRANSIT
Units Indicated in Table, Halifax, 2016
CMA
Population per square km of land area
Share of population near public transit stop
Share of commuters
Average commuting duration in minutes
St. John's
442
60%
48%
19.2
Halifax
74
71%
48%
24.0
Quebec City
903
83%
49%
22.3
KCW
1,381
86%
48%
22.8
Regina
1,107
90%
51%
18.0
Victoria
1,850
90%
47%
22.1
Source: Statistics Canada, Proximity to Public Transportation in Canada’s Metropolitan Cities, Table 23-10-0286-01
Proximity to Transit
- In 2016, 71% of residents in Halifax lived near a public transit stop (within 500 meters). Although this is lower than most benchmark cities, the fact that Halifax has a larger and more widespread rural community should be considered. Halifax had, by far, the lowest population per square km (74 people) across all benchmark cities.
- Halifax’s longer average commuting time can also be explained to some extent by its large area and significant rural population.
- All benchmark cities are clustered near the 50% mark in terms of the population share who are commuters.
Halifax Index 2021
Transportation
High-quality public transit is critical to a city’s thriving economy. Despite pandemic-related restrictions, Halifax Transit increased its hours of service to compensate for decreased seating due to social-distancing regulations. However, transit usage still fell considerably during the pandemic, with the total number of rides falling by 59% in 2020-21.
In comparison to other benchmark cities, Halifax’s transit fares are low. Halifax has the lowest senior and youth fares and among the lowest fares for monthly and single passes. Transit fares were suspended in Halifax between March and August of 2020.
Furthermore, the pilot project that began in 2019 to make public transit free for children 12 years or younger was made permanent early in 2021. This was following a report that estimated children took an additional 500 trips per day since the launch of the project.
Although there has not been a large change in ratings since 2018, MQO Research’s 2021 City Matters Survey found that Halifax residents rate public transit affordability at 6.7 on a 10-point scale. Out of the 4 questions asked, transit affordability was second only to bus stop proximity (7.6). Bus wait times saw the largest improvement between 2020 and 2021, going from 5.9 to 6.2.
-
Source: Halifax Regional Municipality, Halifax Transit
Transit Passenger Volume and Hours of Service
- With social distancing and temporarily-free fares in place, Halifax Transit’s total ridership dropped considerably in 2020-21, falling by 59% (-12,216,000 rides).
- Additionally, total hours of service also decreased by 11.1% (-103,600 hours).
-
TRANSIT FARES BY TYPE OF FARE
Dollars per Fare, Benchmark Cities, 2021
Type of Fare
St. John's
Halifax
Quebec City
KCW
Regina
Victoria
Single Fare
$2.50
$2.75
$3.10*
$2.86*
$3.25
$2.50
Monthly Pass
$78.00
$82.50
$89.50
$90.00
$88.00
$85.00
Senior Fare
$2.50
$1.75
$2.60*
$2.49*
$3.25
$2.50
Youth Fare
$2.00
$2.00
$2.60*
$2.49*
$2.75
$2.50
*Discount only available using tickets and/or “stored value payments.”
Source: Various Municipal SourcesTransit Fares
- Halifax is among the cheapest single fare and has the cheapest youth fare. Halifax also has the cheapest senior fare across benchmark cities. The city takes second position after St. John’s for monthly pass fares.
- While not an indicator of transit quality, low fares do reflect affordability and accessibility.
-
CITIZENS’ RATINGS OF PUBLIC TRANSIT
Mean Scores (1 to 10), Halifax, 2018 to 2021
Category
2018
2019
2020
2021
Buses stop close to where you live and work
6.9
6.6
7.1
7.6
Buses run on schedules that are convenient for you
5.9
5.7
6.0
6.1
Buses arrive frequently and wait times are short
5.8
5.7
5.9
6.2
Affordability of public transit
6.7
6.7
7.0
6.7
Source: MQO Research, City Matters Survey (2020)
Public Perceptions
- Residents’ ratings of public transit have been improving year after year in Halifax.
- From 2018 to 2021, the largest improvements were seen in stop proximity from respondent’s residence and wait times for rides.
- Affordability of public transit was the only rating that did not improve between 2018 and 2021. However, it still remained the second-highest rated item.
Halifax Index 2021
Community
The 2021 City Matters Survey results allow us to quantify measures of trust in Halifax. When asked if most people in the community could be trusted, 58% of respondents replied positively. Males reported a slightly higher feeling of trust than did females. Additionally, older and rural respondents were more likely to state that they trust others in the community.
Engage Nova Scotia’s Quality of Life Survey conducted in 2019 asked residents across the province about their perceptions on various quality of life topics. More than 50% of Halifax residents reported being satisfied with most well-being indicators. The results of this survey, though, should be interpreted with caution as residents’ perceptions might have changed over the course of the pandemic.
One community indicator of civic health is voter turnout. Although election turnout varies from federal (higher turnout) to provincial (middle) to municipal (lower) elections, Halifax has experienced reasonably consistent turnout rates over the last decade. As well, municipal elections held in 2020 had increased voter turnout rates: 8 percentage points in the mayoral election and 6 percentage points in the HRM Council election.
Inclusiveness in a community can be measured by the degree to which its leaders reflect the population. Halifax elects 46 representatives2, and in 2020, 17 (37%) of the representatives elected were female, an increase from 10 in 2018. However, this still falls short of the share of women in the general population. African Nova Scotians make up 7% of elected leaders while 4% of Halifax residents self-identified as Black in the 2016 Census. There are no elected representatives who identify as Aboriginal, but 4% of the population identified as Aboriginal in the last census.
-
RESIDENTS’ FEELINGS OF TRUST
Share of Responses “Most People Can be Trusted”, Halifax, 2021
Response
Overall
Gender
Age
Area
Male
Female
18 - 34
35 - 54
55+
Urban
Rural
Yes
58%
61%
56%
47%
52%
73%
58%
62%
No
28%
29%
26%
34%
33%
18%
28%
25%
Don’t know
13%
9%
17%
19%
14%
7%
14%
12%
Prefer not to say
1%
1%
1%
0%
1%
2%
1%
1%
Source: MQO Research, City Matters Survey (2021)
Trust
- In 2021, the percentage of respondents who stated that most people in their community can be trusted dropped 9 percentage points to 58%. There were 61% and 56% of males and females, respectively, who held this positive view. A higher share of older respondents and those in rural areas believed this.
- A relatively large proportion of respondents below the age of 55 did not think that most people can be trusted. This share decreased by 4 percentage point for those ages 18 - 34 and 22 percentage points for those 35 - 54 since the 2020 survey.
-
Source: Engage Nova Scotia, Quality of Life Survey (2019)
Residents' Satisfaction With Areas That Affect Wellbeing
- Overall, more than 50% of residents said they were satisfied (scale: 5-7) with the various wellbeing indicators except for local government’s response time (36%).
- The wellbeing indicators most residents were extremely satisfied with were “neighbourhood as a place to live” (27%), “work situation” (26%), and “personal relationships” and “mental health” (24% for each).
- These data were collected in 2019, and there is a high possibility that satisfaction has changed since then given the pandemic and other factors.
-
*Methods for enumerating eligible voters vary slightly between jurisdictions.
Source: Various including Elections Canada, Elections Nova Scotia, and Halifax Regional MunicipalityVoter Turnout By Election
- As a jurisdiction gets more local, voter turnout rates tended to drop. Federal elections stayed in the 70-80% range, provincial figures were in the 50-60% range, and municipal turnouts were in the 30-40% range.
- Both the 2020 mayoral and council elections saw a higher voter turnout compared to previous years.
-
Source: Various including 2016 Census Canada, Halifax Regional Municipality, House of Commons Canada, and the Nova Scotia LegislatureElected Officials' Representativeness
- According to the 2016 Census, the largest gap between general population and elected leader demographics was in gender. Females make up 52% of the population, but only 37% of elected representatives were female.
- Seven per cent of elected representatives in 2021 were Black and 4% of the population identified as Black in 2016. Another 4% of the city’s 46 elected representatives were members of other visible minorities, and there were no elected representatives of Aboriginal identity.
-
DIFFICULTY WITH MENTAL HEALTH DURING COVID-19
Share of Residents, Halifax, 2021
Gender
Age
Area
Response
Overall
Male
Female
18 - 34
35 - 54
55+
Urban
Rural
1 - No difficulties
17%
20%
14%
4%
19%
27%
16%
25%
2
9%
9%
8%
2%
8%
15%
8%
11%
3
10%
11%
9%
6%
11%
11%
10%
8%
4
11%
13%
9%
14%
10%
9%
9%
13%
5
12%
13%
11%
8%
16%
11%
12%
11%
6
7%
7%
8%
12%
7%
4%
8%
6%
7
10%
11%
8%
13%
11%
6%
9%
12%
8
8%
5%
11%
17%
6%
4%
9%
6%
9
5%
5%
5%
8%
4%
2%
5%
3%
10 - Major Difficulties
7%
2%
12%
13%
5%
4%
8%
3%
Not applicable
2%
2%
3%
0%
1%
6%
3%
0%
Don't know
2%
2%
2%
3%
2%
2%
2%
2%
Source: MQO Research, City Matters Survey (2021)
Mental Health
- According to City Matters Survey responses, major difficulties with mental health during COVID-19 were more common among females (12%) and those ages 18 - 34 (13%).
- Rural respondents reported lower levels of difficulties than urban respondents.
Halifax Index 2021
Health
Health care in Nova Scotia3and Halifax has changed significantly in recent years, especially in the face of a global pandemic. Strong public health measures have kept COVID-19 largely under control. Other statistics related to chronic diseases and health status, however, often compare poorly to other jurisdictions. While low levels of access remain an issue, there has been a staggering decrease in the size of waitlists for a primary care physician in Halifax.
Nova Scotia confirmed its first COVID-19 case on March 18, 2020, and reached its first peak over a month later: On April 23rd, there were 55. Following quick action from the community and public health authorities, the outbreak was contained. It wasn’t until November 11th that case counts rose again to double-digits, and Nova Scotia entered its second wave. This wave peaked two days later hitting 37 cases but was back to single digits within two weeks.
Although access to primary health care has declined in recent years, Nova Scotia’s situation is average compared with other provinces. In 20194, 85.6% of Nova Scotians reported having access to a regular health care provider, essentially equal to the Canadian average of 85.5%. In comparison, both Ontario and Newfoundland and Labrador boast higher rates, with 90.6% and 87.5% of residents, respectively, reporting access to a regular health care provider.
Recent data indicates the size of waitlists has declined considerably in Nova Scotia’s Central Region, which includes Halifax. Between 2018 and 2020, the Halifax waitlist has fallen from an average 26,458 to 6,313 people. As a share of the population5, this amounts to 6.2% in 2018, falling to 1.5% in 2020. This drop means the Central Region is now below the provincial average of 5.1%.
Atlantic Canadians tend to have higher rates of many chronic health conditions than residents of other provinces, and Nova Scotians are no exception. Among benchmark city provinces, Nova Scotia has the highest rate of chronic obstructive pulmonary disease (COPD) and higher rates for conditions such as arthritis, asthma, and high blood pressure. Notably, Nova Scotians are much more likely to report chronic mental health conditions than other Canadians, with 13.1% reporting some form of mood disorder compared to 9.0% nationally.
Similarly, Nova Scotians tend to have higher rates of activities with negative health effects, such as smoking and drinking. In 2019, 18.3% of Nova Scotians reported being a daily or occasional smoker, and 22.0% reported engaging in heavy drinking. These rates were second only to Newfoundland and Labrador. Nova Scotians were much more likely to report getting vaccinated for influenza with roughly half (49.4%) reporting a vaccination in the past 12 months. This was significantly higher than the Canadian average (33.6%) and higher than any other province.
Among provinces that contain a benchmark city, Nova Scotians have the worst perceptions of and satisfaction with their overall health. Only 55.8% of Nova Scotians considered their health to be “very good” or “excellent” in 2019, lower than the national average of 61.2%. Similarly, only 62.3% rated their mental health as “very good” or “excellent,” compared to the national average of 67.1%. The share of Nova Scotians “satisfied” or “very satisfied” with life is similar to the national average. An exception to this trend is life stress; Nova Scotians were much less likely to report that they experience “high” or “extreme” levels.
-
*Population based on 2020 annual population counts from Statistics Canada Table 17-10-0137-01.
Source: https://health-infobase.canada.ca/covid-19/epidemiological-summary-covid-19-cases.html#a2Average COVID-19 Weekly Case Counts
- There were, on average, 35.1 confirmed COVID cases in Nova Scotia each week between the start of the outbreak6and the end of 2020. Adjusted for population, this is 3.6 cases per week per 100,000 residents.
- In 2020, Nova Scotia experienced two peaks in confirmed COVID cases, with 55 cases reported on April 23rd and 37 cases reported on November 24th.
- Since the start of 2021, Nova Scotia has experienced a third wave of cases, peaking at 227 cases confirmed on May 7, 2021.
- For the latest statistics, see the Nova Scotia COVID-19 Dashboard
-
Source: Statistics Canada, Canadian Community Health Survey, Table 13-10-0096-01
Access to a Regular Health-Care Provider
- The share of Nova Scotians with access to a regular health-care provider has fallen from 88.7% in 2015 to 85.6% in 2019.
- While Quebec has the lowest share of adults with access to a regular health-care provider (78.5%), it is almost the most improved since 2015.
-
*Due to data limitations at smaller geographic levels, all comparisons are made to the 2016 Census population for each area.
Source: http://www.nshealth.ca/reports-statistics-and-accountability#finding-a-primary-care-provider-reportingWaitlist Length for Primary Care Provider
- The Central Region waitlist has fallen dramatically from 6.2% of the population in 2018 to 1.5% in 2020. Over the same period, waitlists in the Central Region have fallen from 26,458 people to 6,313 people.
- Urban zones such as Dartmouth-Southeastern and Halifax Peninsula-Chebucto have generally had larger waitlists, averaging 4.2% and 4.5% of their respective populations. In comparison, Bedford-Sackville, Eastern Shore-Musquodoboit, and West Hants have waitlists that average 2.9% of their population over the same timeframe.
- The Dartmouth-Southeastern zone has fallen the most in relative terms, dropping from 8,932 people in 2018 to 954 people in 2020, roughly 90%.
- Only the West Hants zone has increased the size of its waitlist, though its waitlist was the smallest in 2018 in both in absolute terms and as a share of population.
-
CONDITIONS AND ACTIVITIES IMPACTING HEALTH
Share of Adults Ages 12+, Provinces Containing Benchmark Cities, 2019
Indicators
NS
NL
QC
ON
SK
BC
Arthritis*
27.1%
30.5%
19.0%
19.8%
20.2%
17.8%
Diabetes
8.0%
10.6%
7.4%
8.6%
7.2%
7.0%
Asthma
8.3%
8.4%
8.0%
7.5%
7.6%
8.0%
Chronic obstructive pulmonary disease (COPD)**
7.2%
5.0%
3.6%
3.7%
4.0%
4.1%
High blood pressure
21.0%
23.4%
16.7%
18.1%
18.6%
15.8%
Mood disorder
13.1%
9.4%
5.8%
9.6%
11.5%
9.6%
Current smoker, daily or occasional 18.3% 19.5% 17.0% 13.8% 16.7% 11.1% Heavy drinking 22.0% 23.6% 19.9% 16.2% 20.0% 18.2% Influenza immunization in the past 12 months 49.4% 36.8% 20.5% 36.6% 39.4% 37.2% *Among respondents ages 15 and older.
**Among respondents ages 35 and older.
Source: Statistics Canada, Canadian Community Health Survey, Table: 13-10-0096-01Health Conditions
- Of all the provinces in Canada, Nova Scotia has some of the highest rates for several chronic health conditions including COPD (highest), arthritis, high blood pressure, asthma, and diabetes.
- In general, Atlantic Canada has the highest rates for chronic health conditions, with Newfoundland and Labrador, New Brunswick, and Nova Scotia typically having higher rates than the national average.
- Nova Scotians are much more likely to report mental health difficulties, with 13.1% reporting some form of mood disorder compared to 9.0% nationally.
- Nova Scotians were more likely to report smoking or drinking than people in other provinces. Among all provinces in Canada, only Newfoundland and Labrador reported higher rates.
- Nova Scotians were the most likely to report being vaccinated for influenza, with 49.4% reporting a vaccination in the past 12 months. This was significantly higher than the Canadian average (33.6%).
-
SELF-REPORTED PERCEPTIONS OF HEALTH STATUS
Share of Adults Ages 12+, Benchmark Cities, 2020
Indicators
NS
NL
QC
ON
SK
BC
Perceived health, very good or excellent
55.8%
64.2%
62.1%
61.3%
57.5%
60.0%
Perceived mental health, very good or excellent
62.3%
68.7%
72.1%
65.9%
62.8%
64.8%
Life satisfaction, satisfied or very satisfied
92.1%
92.2%
95.3%
92.6%
94.2%
93.0%
Perceived life stress, most days quite a bit or extremely stressful
18.5%
13.7%
23.6%
21.7%
18.6%
19.9%
Source: Statistics Canada, Canadian Community Health Survey, Table: 13-10-0096-01
Health Perceptions
- Fewer Nova Scotians reported having “very good” or “excellent” health than the national average (55.8% vs 61.2%, respectively).
- The share of Nova Scotians with good or excellent perceptions of physical health has declined, falling from 59.4% in 2015 to 55.8% in 2019. Perceptions of mental health have also fallen, from 68.9% to 62.3%.
- Nova Scotians were less likely to report feeling high levels of life stress, 18.5% as compared to 21.4% nationally.
Halifax Index 2021
Crime
Over the past decade, Halifax has become a safer place to live and work, with less crime. The Crime Severity Index (CSI)7, 8and the Violent Crime Severity Index (VCSI)9published by Statistics Canada measure the incidence and severity of crimes committed across Canadian cities.
Halifax’s most recent CSI was 60.7 in 2019, dropping 6.7 points from the previous year and 37.5 points over the past decade. Both the annual and the decade-long decreases were the largest improvements among all benchmark cities.
The VCSI score for Halifax fell 12.7 points between 2018 and 2019 and 37.5 points over the decade. Again, Halifax saw the largest annual decrease and the largest 10-year decrease in the VCSI across the benchmark cities. Still, Halifax had the third-highest VCSI score among the 6 cities at 83.8 points.
In 2019, 80,000 Nova Scotia households were surveyed to measure perceived quality of life across the province. One of the 8 key areas the survey focused on was community vitality, which included a question asking respondents to rank confidence in the police, justice system and courts, school system, and health-care system. Out of the 4,632 Halifax residents that responded, about 77% had a positive view of the police, about 11% had a negative view, and about 12% were neutral.
-
Source: Statistics Canada, Uniform Crime Reporting Survey, Table 35-10-0026-01
Crime Severity Index and Annual Change
- Halifax had the second-lowest CSI score in 2019 with 60.7 points. Quebec City had the lowest (best) at 43.8, and Regina had the highest (worst) with 130.0.
- From 2009 to 2019, Halifax’s CSI score fell 37.5 points, the largest drop across all benchmark cities.
-
Source: Statistics Canada, Uniform Crime Reporting Survey, Table 35-10-0026-01
Violent Crime Severity Index and Annual Change
- Halifax’s VCSI score in 2019 was 83.8. This marked a decrease of 12.7 between 2018 and 2019 and 37.5 points over the decade.
- Although Halifax has seen a substantial decline in the VCSI, it still has the third-highest score across benchmark cities.
- Just as with the CSI, Quebec City had the best VCSI score in 2019 (57.3) and Regina the worst (132.7).
-
Source: Engage Nova Scotia, Quality of Life Survey
Public Confidence in the Police
- According to the Quality of Life Survey conducted in 2019, a small percentage of Halifax residents had low levels of confidence in the police. There were 2% that noted they had “no confidence” and about 10% had a less than favourable view. Though this may seem small, it is a significant size of the community.
- A large proportion (about 77%) of respondents said they had confidence in the police. One-quarter stated that they had a “great deal of confidence” in the police, and more than three-quarters of all respondents rated their confidence level above “neutral.”
Halifax Index 2021
Environment
Overall, Halifax compares well to other cities on several environmental benchmarks though progress has stalled or reversed on some measures.
At 60%, Halifax has the second-highest residential waste-diversion rate in the country, behind only Kitchener-Cambridge-Waterloo (65%), according to the 2019 MBNCanada Performance Measurement Report10. Divert NS11 reports that across the province 110,000 tonnes of organic waste and 119,000 tonnes of construction and demolition waste have been diverted since 2018. Additionally, in 2020, Nova Scotia reached milestones in recycling: 7 billion beverage containers and over 24 million used tires since 1996. Composting is also popular in Halifax with 88% of households composting kitchen and yard waste in 2019, the second-highest share across benchmark cities. However, this is down from 2013 (97%).
Nova Scotia’s greenhouse gas emissions from the electricity sector12have been cut by 38% since 2005, while total GHGs have been reduced by 29.9%, well ahead of the federal 30% reduction target set for 2030 as set out in the Paris Agreement. Ottawa recently increased the reduction target to 40% of 2005 levels to be achieved over the next 9 years. The province’s renewable-energy supply tripled in the last decade, reaching 29% in 2020. Given delays in the Muskrat Falls project and issues related to COVID-19, the Province has extended Nova Scotia Power's deadline to reach 40% renewable energy generation to 2022.
The average annual temperature for Halifax in 2020 was 1.4 degrees warmer than it was a century earlier in 1920. Average seasonal temperatures in Halifax also have been rising over the last 3 decades with summers becoming noticeably warmer since 2000.
-
RESIDENTIAL WASTE-DIVERSION RATE
Share of Solid Waste, Halifax, 2014 to 2020
Waste Diversion
Year
Diversion Rate
2014-15
61%
2015-16
59%
2016-17
60%
2017-18
60%
2018-19
59%
2019-20
60%
Source: Halifax Regional Municipality, Transportation and Public Works
Waste Diversion
- The municipality’s waste-diversion rate has been consistent within the 59% to 61% range for the last 10 years.
- The waste-diversion rate in Halifax (60%) was the second highest across the country according to the MBN report (2019), behind only Kitchener-Cambridge-Waterloo (65%).
-
KITCHEN AND/OR YARD WASTE COMPOSTING
Share of Households, Benchmark Cities, 2009 to 2019
Halifax
St. John's
Quebec City
KCW
Regina
Victoria
2009
92%
48%
40%
75%
33%
65%
2011
93%
53%
42%
70%
45%
78%
2013
97%
55%
45%
81%
37%
71%
2015
94%
54%
43%
82%
44%
93%
2017
91%
42%
50%
77%
36%
97%
2019
88%
56%
50%
77%
55%
91%
Source: Statistics Canada, Households and the Environment Survey, Table 38-10-0128-01
Composting
- In 2019, 88% of households in Halifax composted their kitchen and yard waste, the second-highest share across benchmark cities.
- However, the 2019 share was the lowest recorded in Halifax, down from a peak of 97% in 2013 and dropping below the 90% mark for the first time since data collection for this series began.
-
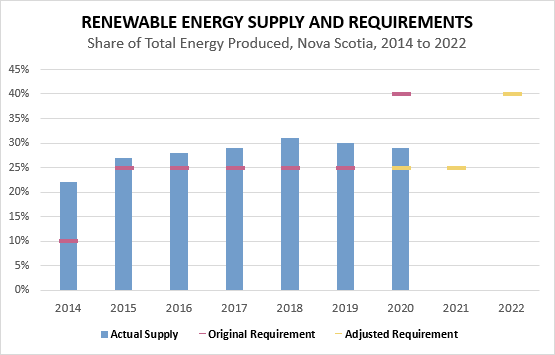
Source: Nova Scotia Power, Renewable Energy Regulations
Renewable Energy
- Nova Scotia’s share of energy supply from renewable sources (wind, hydro, tidal, etc.) was 29% in 2020, down slightly from 30% in 2019. Even with this decrease, the 2020 share surpassed the 25% requirement.
- The renewable share has tripled in the last decade although recent growth has fallen short of expectations due to delays in sourcing energy from the Muskrat Falls Project in Labrador.
- The province has reduced GHG emissions from the electricity sector by 38% of 2005 levels. Overall GHG emissions across the province were 29.9% below 2005 levels in 2019, well ahead of the federal target of a 30% reduction by 2030. The Government of Canada announced a new target in April 2021: 40% of the 2005 level by 2030.
-
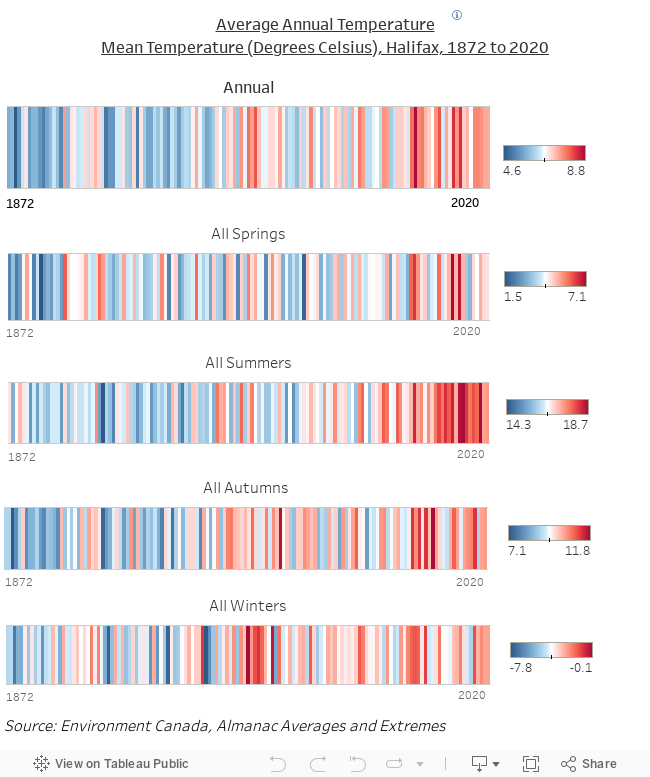
Temperature
- Average surface temperatures in Halifax have been noticeably higher over the last 30 years. Across 139 years of data, 17 of the 30 warmest years all have occurred since 1990. Of the coolest 30 years, the most recent was 1972 and only 8 have occurred within the past century.
- The 12 hottest summers on record – and 21 of the top 30 – all have occurred since 1990.