Halifax Index 2020

Living & Affordability

Scroll to top

You are viewing the 2020 Halifax Index.

To view the current edition, click here.

All Halifax Index editions: 2023 | 2022 | 2021 | 2020

Aside From Housing Affordability, Livability Indicators Improved

The average Halifax household saw its purchasing power grow in 2019 as incomes rose faster than prices. The rates of growth in Halifax from 2018 to 2019 for both income and prices were close to the national average. However, Halifax had the lowest per capita income across its benchmark cities.

Growth in single-home and multi-unit construction was very strong in 2019, particularly in rural Halifax. The average resale price for a house jumped significantly while the price increase for new homes was more modest. Apartment vacancy rates dropped to record lows, driving average rents higher.

Non-mortgage debt for the average Halifax consumer dropped slightly, while the debt delinquency rate stayed the same. Halifax’s average debt level was close to the Canadian average, but its delinquency rate was substantially higher.

Satisfaction with many quality of life measures reached record highs in this year’s City Matters Survey, carried out by MQO Research, including a record high for the overall quality of life rating. Respondents’ positive views on indoor and outdoor recreational facilities and views on arts and cultural events hit their highest levels since these questions were first posed in 2014. Also breaking records is the share who believe Halifax is a good place to raise a family and feel safe in their community. The only quality of life factor that registered a decline was housing affordability, which dropped to a record low.

COVID-19 Impacts

Like all other subjects covered in the Halifax Index, living and affordability are being affected by the COVID-19 crisis. In 2020, many people will experience income reductions – in some cases very substantial ones. In turn, these losses may lead to greater debt levels and higher default rates. These will be mitigated to some extent by the substantive income and liquidity support programs rolled out across all levels of government. Impacts on prices, in general, and for housing, specifically, are unpredictable, especially given the uncertainty as to when migration flows will return to pre-crisis levels.

The City Matters Survey data reported here were gathered between March 18 and 26, 2020, after schools and many businesses were closed and isolation measures were in place. Somewhat surprisingly, most quality of life indicators measured through the survey were at or near record highs. Perhaps at that time respondents anticipated a very brief lockdown, and as such, the pandemic did not affect their judgment. Alternatively, respondents may have been more inclined to “count their blessings” in light of the havoc that COVID-19 was wreaking around the world.

Halifax Index 2020
Income & Prices

At $47,600, Halifax’s residents earned the lowest household income per capita of the 6 benchmark cities. Per capita income grew by 2.6% in Halifax throughout 2019, third among benchmark cities and just shy of the 2.8% national growth rate.

The price of consumer goods in Halifax grew at an average pace compared to the benchmark cities, rising by 1.7% in 2019. Purchasing power (the difference between per capita income growth and inflation) grew by 0.9%, meaning that the average Halifax household effectively had more money in its pocket. Of the benchmark cities, only Victoria experienced a decrease in purchasing power.

Consumer spending will be limited throughout 2020 due to pandemic shutdowns and the large-scale loss of employment for many individuals. Inflation will be unstable and income growth is expected to be low, if not negative, as a result of COVID-19.

  • Source: Conference Board of Canada, Metropolitan Outlook - Winter 2020

    Household Income Per Capita

    • Halifax’s household income per capita lags behind the other benchmark cities and grew at an average rate throughout 2019.
    • St. John’s took the lead spot from Victoria for highest household per capita income among the benchmark cities.

  • Source: Conference Board of Canada, Metropolitan Outlook - Winter 2020

    Annual Change in Purchasing Power

    • Income, inflation, and purchasing power all grew at an average pace in Halifax as compared to the 6 benchmark cites.
    • Purchasing power increased by 0.9% in Halifax through 2019, meaning goods and services became slightly more affordable for the average household.

Halifax Index 2020
Housing

New home construction was in full swing throughout 2019, especially in rural Halifax. Construction began on 872 single-unit houses, exceeding 2018’s figure by 143 units (20% growth) and outpacing the 10-year average by 126 units. Most of these starts were in rural Halifax, where the construction of single-unit housing has nearly doubled over the last 5 years. Construction on single-unit housing slowed in both urban and suburban regions in 2019.

Construction on multi-unit housing reached a new record in 2019 with work beginning on 2,271 new units. Of these, 91% were apartment-style housing, 7% were row-housing, and the remaining 3% were semi-detached. Multi-unit starts grew by 25% in rural regions and 16% in the suburbs, while falling by 26% on the peninsula. The 957 multi-units started in rural Halifax through 2019 set a new annual record for multi-units in rural regions.

Increasing the pace of housing construction helps to keep prices low and is especially important given the increase in demand resulting from our rapid population growth over the last 5 years.

Rental supply has not kept up with demand despite more apartment buildings being under construction than ever before. As a result, apartment vacancy rates declined sharply over the last 5 years, reaching a record low of 0.9% vacancy for 2-bedroom apartments in 2019. According to the Canada Mortgage and Housing Corporation (CMHC), apartment vacancy rates are lowest in the Peninsula South, Bedford, and Rural regions of Halifax. Monthly rent also rose by 4.0% in 2019, bringing the average rent for a 2-bedroom apartment up to $1,202 per month (+$46 over 2018).

Home ownership has not experienced the same demand pressures as rental properties in recent years. The average price of a new single-detached house in Halifax was $463,843 in 2019 – half the national average. Among the 6 benchmark cities, Halifax remains the third most affordable place to purchase a new single-detached home and the fourth most affordable to purchase a resale home.

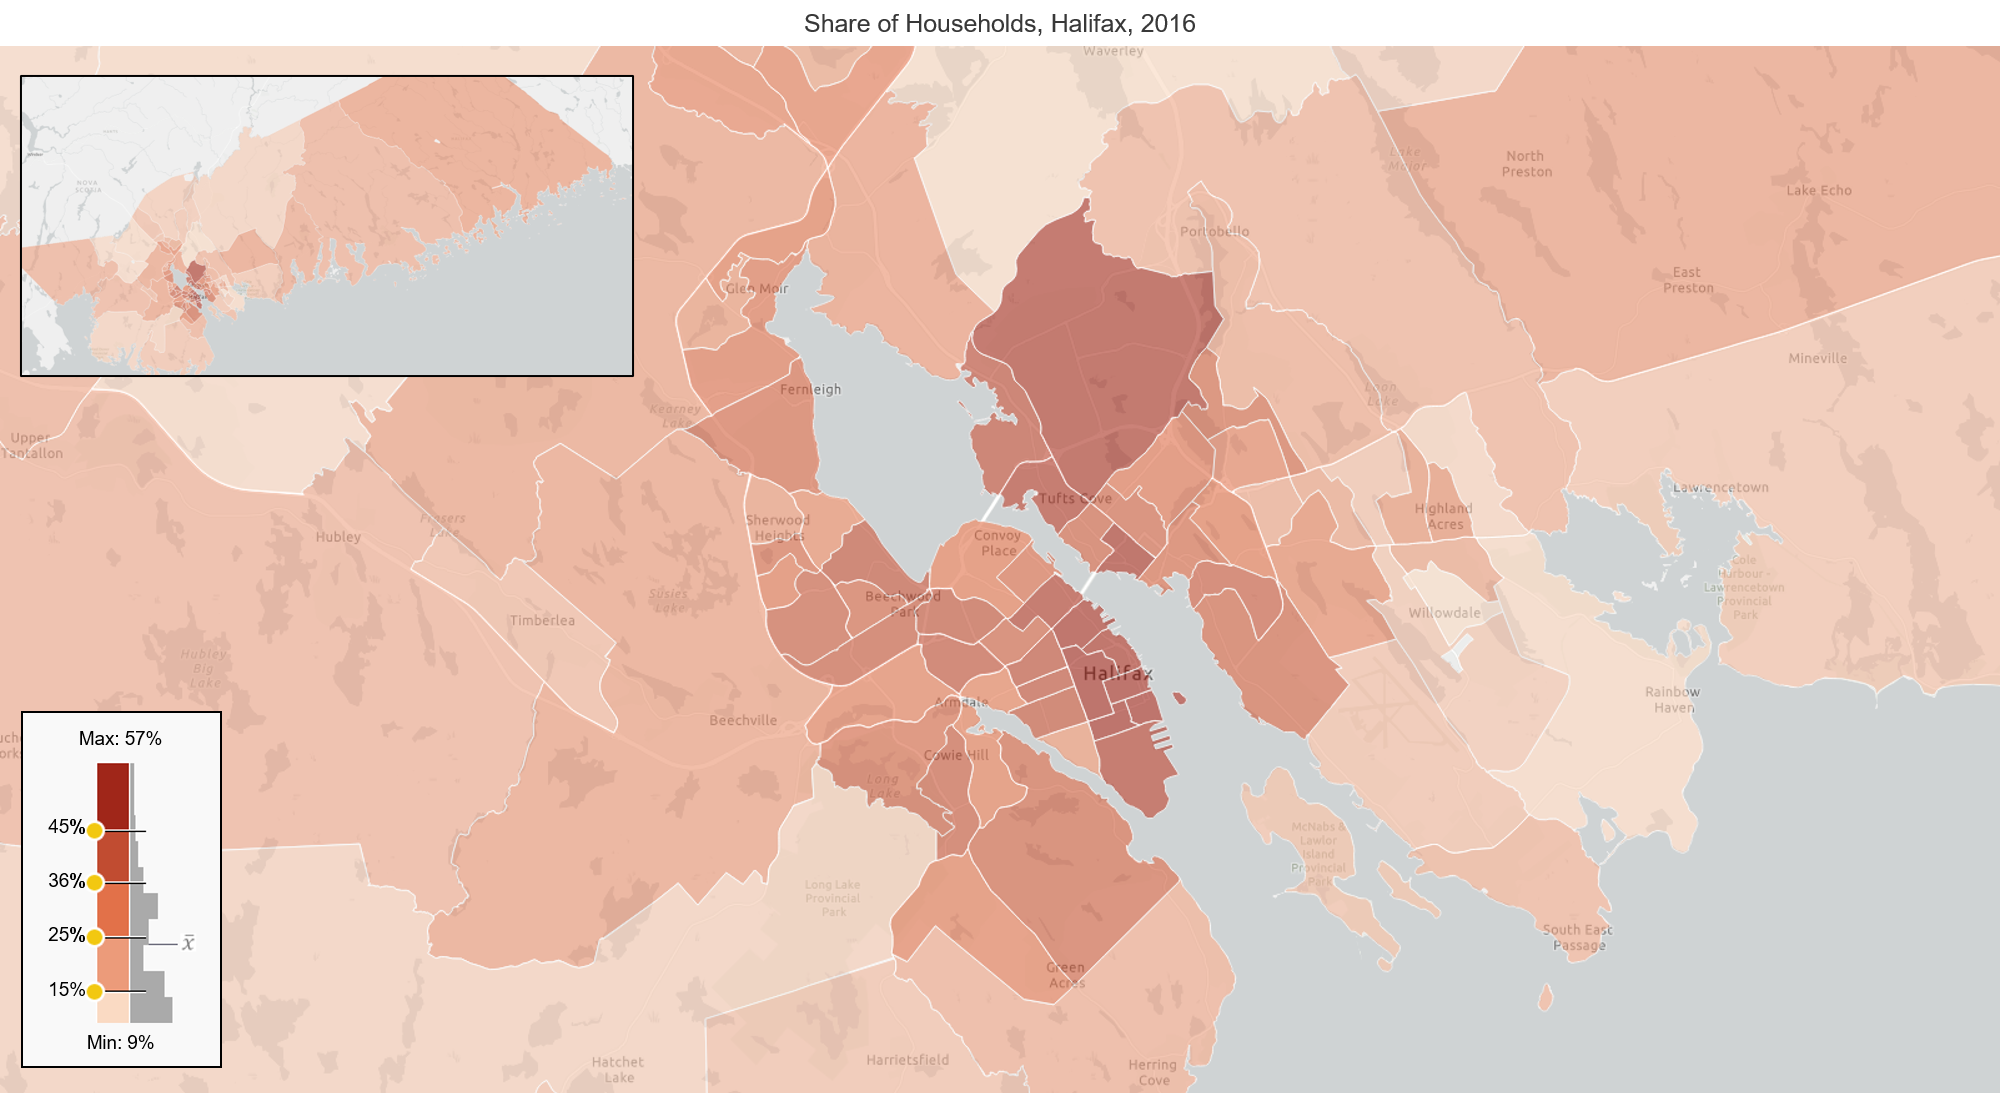
A measure often used to assess housing affordability is the shelter-cost-to-income ratio. Using data from the 2016 census, we can look at various regions in Halifax to understand where affordability pressures are the highest. Overall, one-quarter of all households spend more than 30% of their income on shelter. Housing affordability pressures are most acute in and around the downtown and less acute in rural regions.

  • Source: Canada Mortgage and Housing Corporation, Housing Market Information Portal

    Single and Multi-Unit Housing Starts

    • 2019 set an annual record for the most multi-unit starts, with construction beginning on 2,271 units, 420 greater than the 10-year average of 1,851.
    • 91% of 2019’s multi-unit starts were apartment units, 7% were row units, and 3% were semi-detached units.

  • Source: Canada Mortgage and Housing Corporation, Housing Market Information Portal

    Single and Multi-Unit Housing Starts by Region

    • Construction on single-unit homes increased in rural Halifax (+33%) and slowed in urban (-18%) and suburban regions (-2%).
    • 2019 set a record high of 957 multi-unit starts in rural Halifax (+25%).
    • Housing starts were split evenly between rural and urban Halifax in 2019. This is a notable change as two-thirds of the housing built in the last 5 years was in urban neighbourhoods.

  • Source: Canada Mortgage and Housing Corporation, Housing Market Information Portal

    Two-Bedroom Apartment Rent and Vacancy Rates

    • Apartment vacancy rates plummeted to their lowest level ever in 2019.
    • Rental rates in Halifax surpassed Regina, moving Halifax up to the third-highest monthly rent among benchmark cities, behind KCW ($1,223/mo) and Victoria ($1,454/mo).
    • Halifax and Victoria have the lowest overall apartment vacancy rate of the benchmark cities at 0.9% and 1.1%, respectively.

  • *Data are unavailable for St. John’s; Newfoundland and Labrador prices were used as a proxy.
    Source: Canada Mortgage and Housing Corporation, Housing Market Information Portal and Conference Board of Canada, Metropolitan Resale Snapshot

    Average vs Resale Home Prices

    • The average price of a new single-detached home in Halifax was $463,843 in 2019 – half the national average and fourth most expensive among the 6 benchmark cities. The price of a new single-detached home rose by 2% in Halifax last year, the second largest increase of the benchmark cities. (Regina took top spot with an 11% increase.) Single-detached prices decreased in 3 of the benchmark cities in 2019.
    • Housing resale prices rose by 11% in Halifax through 2019, bringing the average resale price to $333,846. Resale prices increased by 15% in Kitchener-Cambridge-Waterloo and decreased in the remaining four benchmark cities.

  • Share of Households Exceeding 30% Spending on Shelter

    Source: Statistics Canada, Census of Canada

    Affordability

    • Overall, one-quarter of Halifax households spend more than 30% of their income on shelter. 1
    • Using data from the 2016 census, we took a regional view of census tracts to understand where affordability pressures are the highest. Darker coloured census tracts in this map have a higher share of households spending more than 30% of their income on shelter costs. Housing affordability pressures are most acute in and around the downtown and less acute in rural regions.

Halifax Index 2020
Consumer Debt

The quality and affordability of life for Halifax residents is affected by the levels of debt they carry. Consumers can take on debt to spread out the cost of a large purchase over time. This lets them buy important things earlier in life, such as a car or a home, and expand their economic opportunities. However, too much debt can be a sign of vulnerability in the economy as consumers struggle to pay back money they borrowed.

The average Halifax consumer had $23,564 in non-mortgage debt at the end of 2019, just below the Canada-wide average of $23,760. From 2017 to 2018 and from 2018 to 2019, the average debt level in Halifax dropped by 0.8 and 0.5 percentage points, respectively.

The debt delinquency rate in Halifax at the end of 2019 was 1.52%, down slightly from the 2018 figure of 1.54%, but up from 1.43% in 2017. In all 3 years, Halifax’s delinquency rate was 1.3 times greater than the figure for Canada overall.

The number of consumer insolvencies2in Halifax rose in 2019 to its highest level from 2011 to 2019. However, the number of bankruptcies3fell for the third straight year and was the lowest over the 2011 to 2019 period. Halifax’s rate of consumer insolvencies per capita in 2019 was the second highest among the 6 benchmark cities.

Consumer debt levels, the debt delinquency rate, and insolvency numbers all may jump sharply in 2020 as a result of the current economic crisis. Job and income losses may compel people to take on debt and impair their ability to make loan payments.

  • Source: Equifax Canada, Canadian Consumer Credit (Various)

    Non-Mortgage Debt Per Consumer

    • The average consumer debt load in Halifax has dropped over the past 3 years while it has grown for Canada overall. The average Halifax consumer now has slightly less debt than the average Canadian.
    • Among 8 major Canadian cities reported on by Equifax, Halifax sat in the middle of the pack. The highest debt figure was reported for Calgary at $29,789 and the lowest for Montreal at $17,958. Comparable figures for most of Halifax’s benchmark cities are not available.

  • Source: Equifax Canada, Canadian Consumer Credit (Various)

    Consumer Debt Delinquency Rate

    • From 2017 to 2019, the debt delinquency rate for Halifax consumers rose and then fell slightly. Meanwhile, the rate for Canadians increased overall.
    • In 2019, oil-dependent cities like Edmonton and St. John’s had higher delinquency rates than Halifax, while Calgary’s rate was slightly lower. Delinquency rates were even lower in other major centres like Toronto, Montreal, Vancouver, and Ottawa. Comparable figures for other benchmark cities are not available.

  • Source: Office of the Superintendent of Bankruptcy, Insolvency Statistics in Canada (Various)

    Consumer Insolvencies by Agreement Type

    • Insolvency data for Halifax consumers tell two different stories. Since 2011, the number of insolvencies has generally risen, reaching a high in 2019. In contrast, the number of bankruptcies has fallen for three consecutive years, reaching a low in 2019.
    • Compared to its benchmark cities, Halifax had the second-highest number of insolvencies per capita in 2019, just ahead of Quebec City. St. John’s had the largest number, while Victoria had the lowest.

Halifax Index 2020
Quality Of Life

Our annual City Matters Survey, conducted by MQO Research, asks 500 Halifax residents to rate their city on several indicators, based on a scale of 1 (very poor) to 10 (excellent). The 2019 results were more positive than ever, with all but one of the key indicators improving and several setting new records.

This year we asked respondents to identify Halifax’s greatest advantage; the most common answer (26%) was size. Respondents described Halifax as a small city with a big city feel. When asked their favourite aspect of living in Halifax, the most common response involved the ocean or waterfront (19%). Other common responses included scenery and beaches, and the friendliness of the people.

We also asked residents what they believed was the most important issue facing Halifax. One quarter of respondents selected affordable housing followed by transit and parking (12%), and infrastructure and roads (10%).

  • CITY MATTERS SURVEY RESULTS
    Share of Respondents, Halifax, 2014 to 2020

    2014 Mean Score

    2017 Mean Score

    2018 Mean Score

    2019 Mean Score

    2020 Mean Score

    Status 2019 vs. 2020

    Overall quality of life

    7.7

    7.2

    7.1

    7.4

    7.7

    Improving

    Good place to raise a family

    7.7

    7.8

    7.4

    7.6

    8.1

    Improving

    Outdoor recreational facilities

    7.3

    6.8

    6.9

    6.9

    7.5

    Improving

    Indoor recreational facilities

    7.2

    6.8

    6.8

    6.9

    7.4

    Improving

    Housing affordability

    6.1

    5.7

    5.5

    5.5

    5.1

    Worsening

    Arts and cultural events

    7.4

    6.8

    7

    6.9

    7.4

    Improving

    City is easy to get around

    6.6

    5.9

    6

    5.6

    6.4

    Improving

    % Who feel mostly safe

    66%

    80%

    80%

    87%

    90%

    Improving

    Source: MQO Research, City Matters (Various)

    City Matters Survey

    Survey Question: Please rate your city on the following items using a scale of one to ten, with one (1) meaning “Very Poor” and ten (10) meaning “Excellent.”

    • 7 indicators improved from the previous year, 6 of which tied or set new record highs.
    • Most notably, the mean scores about Halifax being a good place to raise a family and outdoor recreational facilities scored higher than any other year.
    • Housing affordability was the only indicator whose score decreased, continuing the trend from previous years. Affordable housing was the most-commonly identified issue in this year’s City Matters Survey, with 25% of respondents citing it as the most important issue facing Halifax.


Finance & Taxes

HRM reduced debt levels for the 10th straight year and was in a good fiscal position prior to the COVID-19 crisis. Both HRM and the Province suffered substantial revenue losses as a result of the pandemic and face tough fiscal decisions as we emerge from it.

×

Search

This website uses cookies
This website uses cookies to improve user experience and analyse website traffic. By using our website without adjusting your cookie settings you consent to all cookies in accordance with our Privacy Policy.

Ok